Sales Forecasting Dashboard
Data analytics and forecasting dashboard for sales insights and reporting.
Overview
About this project.
Sales Forecasting Dashboard
Business Intelligence & Predictive Sales Analytics Platform
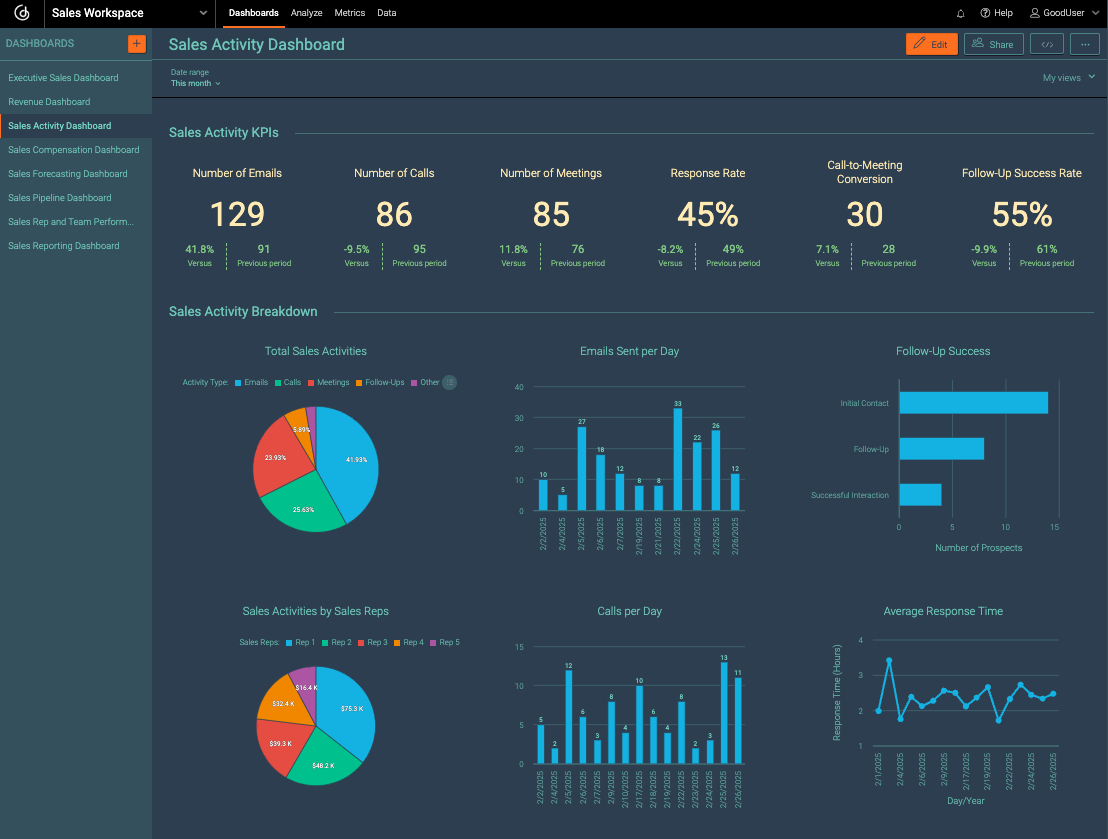
Sales Forecasting Dashboard is a data analytics and business intelligence platform designed to help organizations understand historical sales performance, identify trends and generate forecasts that can support business planning and decision-making.
The platform transforms raw sales data into an interactive dashboard where users can examine sales performance, compare periods, identify patterns and view projected future sales.
Instead of relying solely on spreadsheets and historical reports, the solution provides a centralized analytical environment for exploring sales data and using statistical and machine learning techniques to support forecasting.
Core Capabilities
Sales Performance Analysis
The dashboard provides a structured view of historical sales performance.
Users can analyze metrics such as:
Total sales
Sales by period
Product performance
Category performance
Regional performance
Customer segments
Sales volume
Revenue trends
This allows organizations to identify areas of growth and changes in sales performance.
Interactive Data Visualization
Sales information is presented through interactive visualizations that make complex datasets easier to understand.
Possible visualizations include:
Sales trend charts
Revenue comparisons
Product performance charts
Category breakdowns
Regional analysis
Monthly and yearly comparisons
Forecast charts
Users can interact with the dashboard to explore different dimensions of their sales data.
Sales Forecasting
The platform uses historical sales information to generate projected future sales.
Forecasting can help organizations examine potential future demand and support planning around:
Inventory
Procurement
Production
Staffing
Revenue expectations
Business targets
Forecast results are presented alongside historical performance to make trends and projected changes easier to interpret.
Data Processing
The system provides a workflow for transforming raw sales information into analysis-ready data.
Typical workflow:
Data Upload → Data Cleaning → Processing → Analysis → Forecasting → Visualization
Data preprocessing can include:
Handling missing values
Data validation
Date processing
Aggregation
Data transformation
Feature preparation
This helps ensure that analytical results are based on properly structured data.
Predictive Analytics
The platform can incorporate statistical and machine learning approaches for forecasting depending on the characteristics of the dataset.
Potential approaches include:
Time-series analysis
Regression techniques
Statistical forecasting
Machine learning models
Forecasting models should be evaluated against appropriate historical data, with model performance monitored rather than treating predictions as guaranteed outcomes.
Dashboard Features
The dashboard can provide:
Key performance indicators
Historical sales trends
Forecasted sales
Sales comparisons
Product analysis
Category analysis
Regional analysis
Interactive filters
Date-range selection
Data visualizations
Exportable reports
The interface is designed to allow both technical and non-technical users to explore business performance without manually processing large spreadsheets.
Business Applications
Sales Forecasting Dashboard can support organizations in areas such as:
Inventory Planning
Use projected demand to support inventory and procurement decisions.
Revenue Planning
Examine historical performance and forecast potential future sales.
Business Strategy
Identify trends and changing patterns across products, markets and periods.
Performance Monitoring
Track sales performance against historical data and organizational targets.
Management Reporting
Provide decision-makers with a centralized view of sales performance and forecasts.
Technology
The project demonstrates YasYum Ltd's capabilities in:
Python
Pandas
Scikit-learn
Data analysis
Predictive analytics
Machine learning
Data visualization
Dashboard development
Data preprocessing
Statistical modelling
Interactive reporting
The platform can be extended to integrate with databases, ERP systems, accounting platforms, e-commerce systems or other business data sources.
Data Visualization
A key component of the platform is the presentation of analytical information in an accessible visual format.
Instead of presenting users with raw tables alone, the dashboard can provide:
Trend analysis
Comparative charts
Forecast visualizations
Performance indicators
Interactive filtering
Summary metrics
This allows management teams to quickly explore business performance while still providing detailed information for analysts.
YasYum Ltd Project Capability
The Sales Forecasting Dashboard demonstrates YasYum Ltd's ability to develop data-driven business intelligence and predictive analytics solutions.
The project combines:
Data Engineering • Python • Pandas • Machine Learning • Predictive Analytics • Data Visualization • Dashboard Development • Business Intelligence
It demonstrates how YasYum can transform organizational data into practical analytical tools that support planning, monitoring and informed decision-making.
Potential Industries
The solution can be adapted for:
Retail
E-commerce
Manufacturing
Distribution
FMCG
Financial services
Telecommunications
Hospitality
Healthcare
Government-owned enterprises
Other organizations with structured sales or demand data
Project Vision
The broader objective of the Sales Forecasting Dashboard is to help organizations move from looking only at what happened to also examining what the available data suggests may happen next.
By combining historical analysis, interactive visualization and predictive modelling, the platform provides a foundation for more structured data-driven business planning.
Technologies & Solutions
What was used.
Technologies, systems and platforms deployed in this project.
Related Projects
More from YasYum.
 Software
Concept
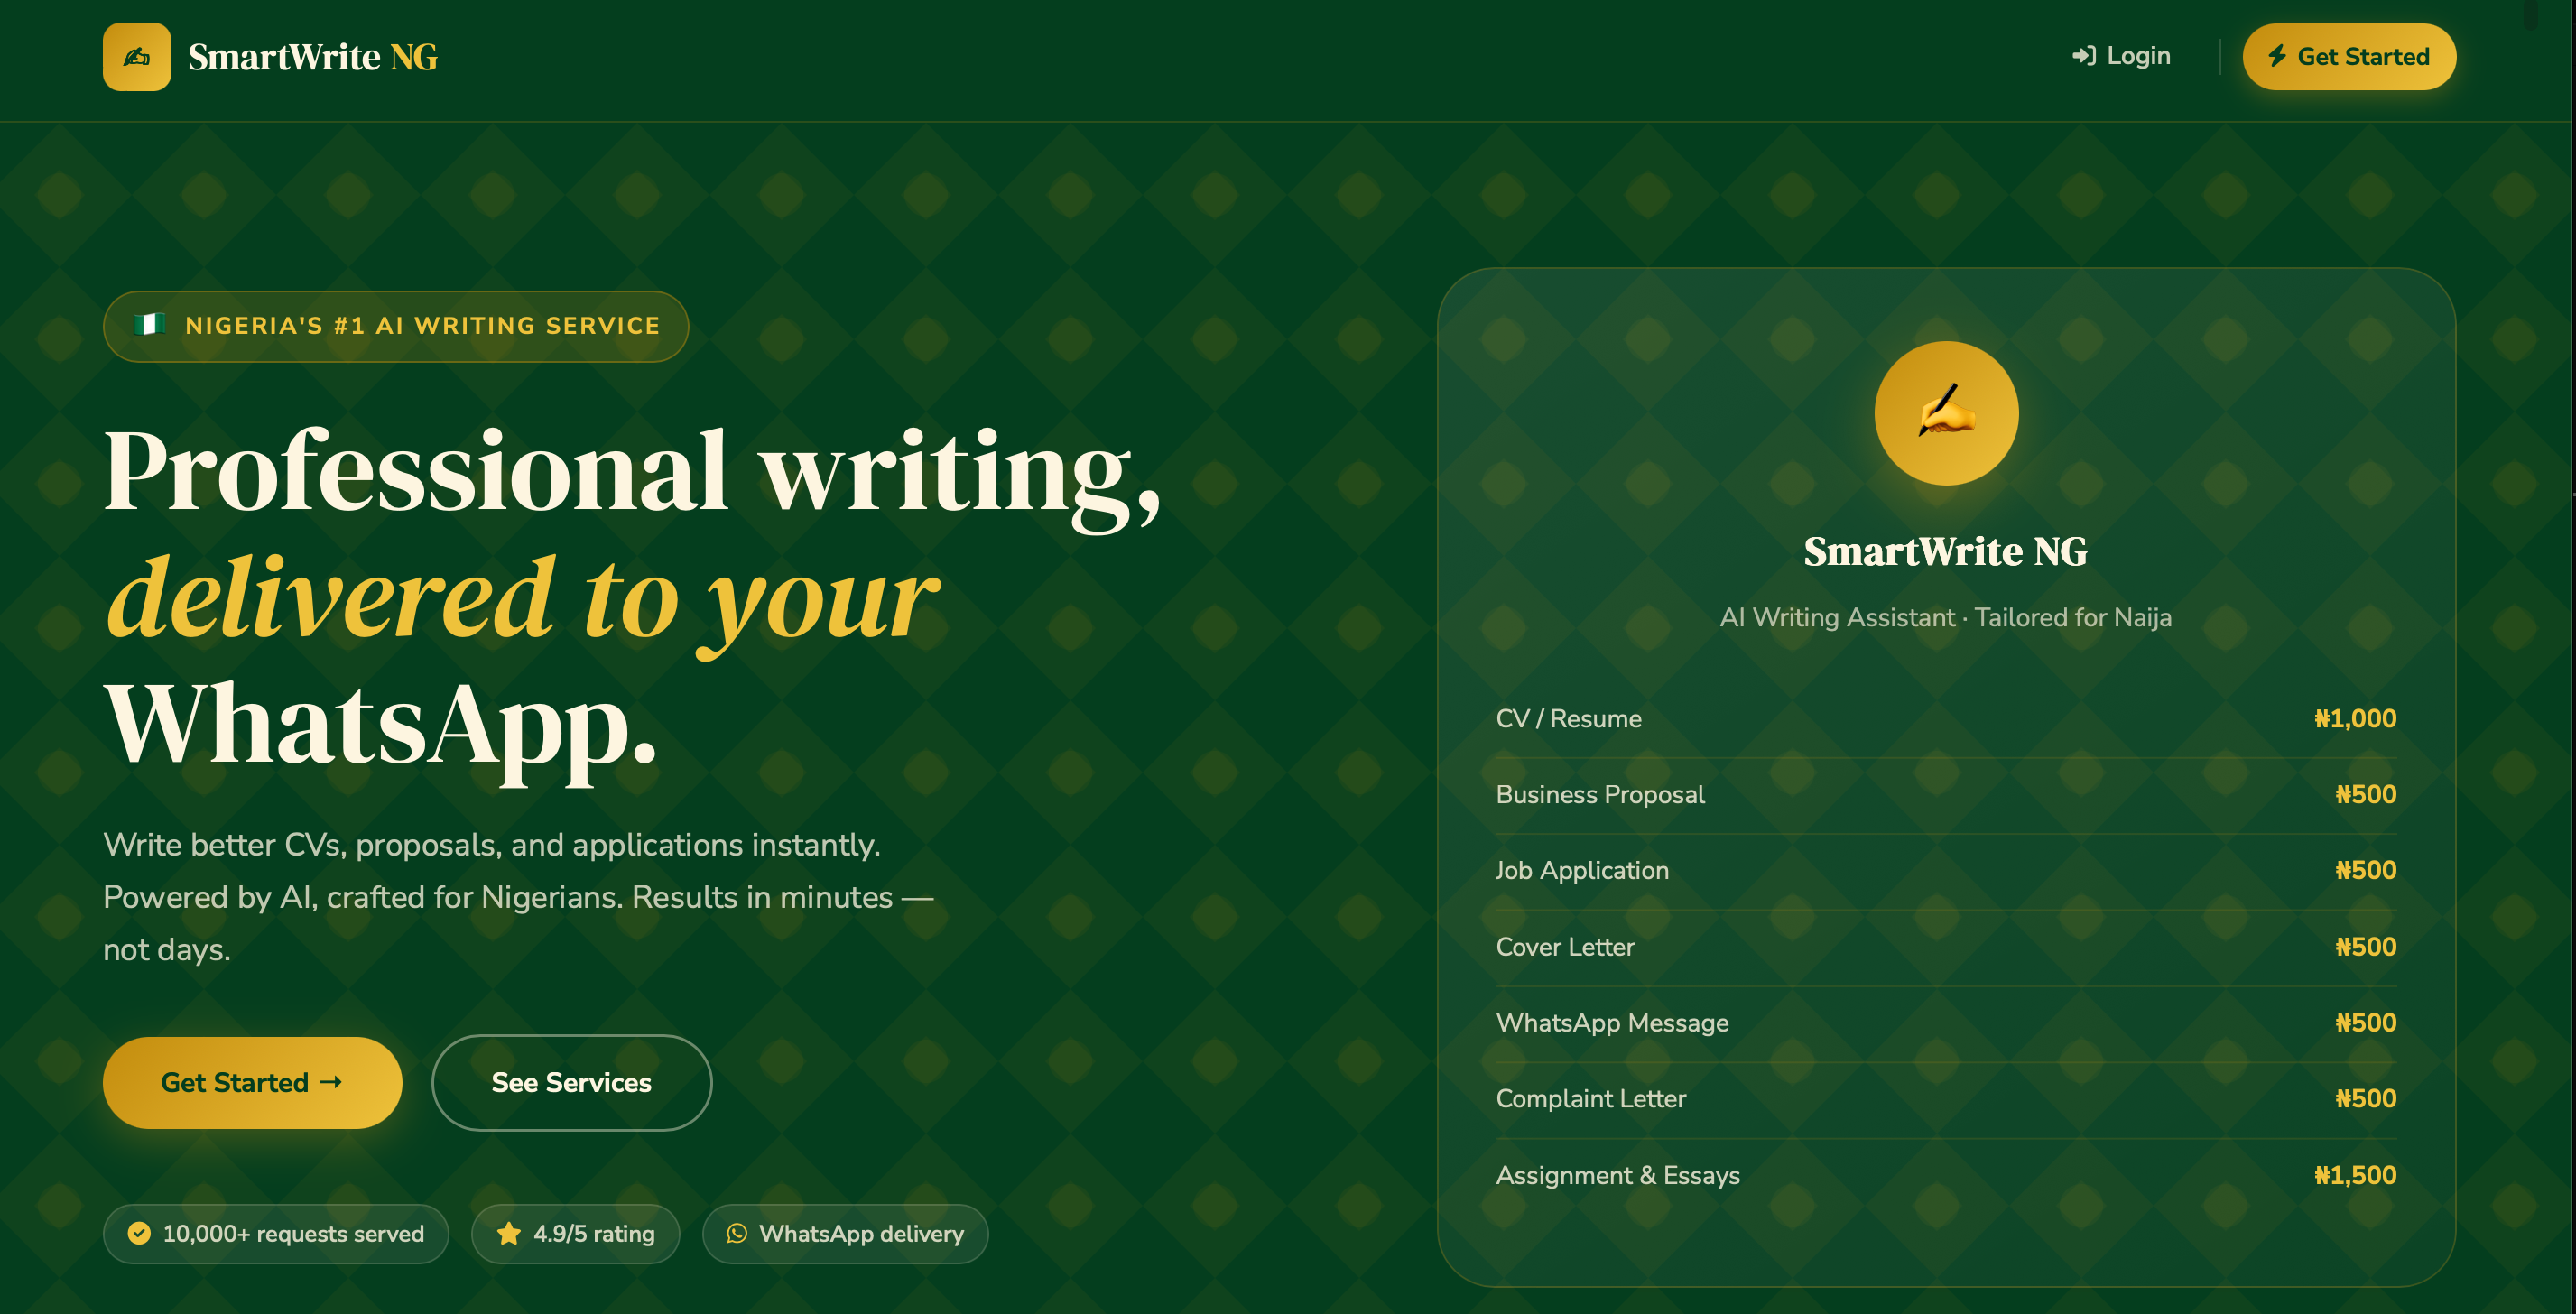
SmartWrite
AI-assisted writing and document productivity platform.
 Software
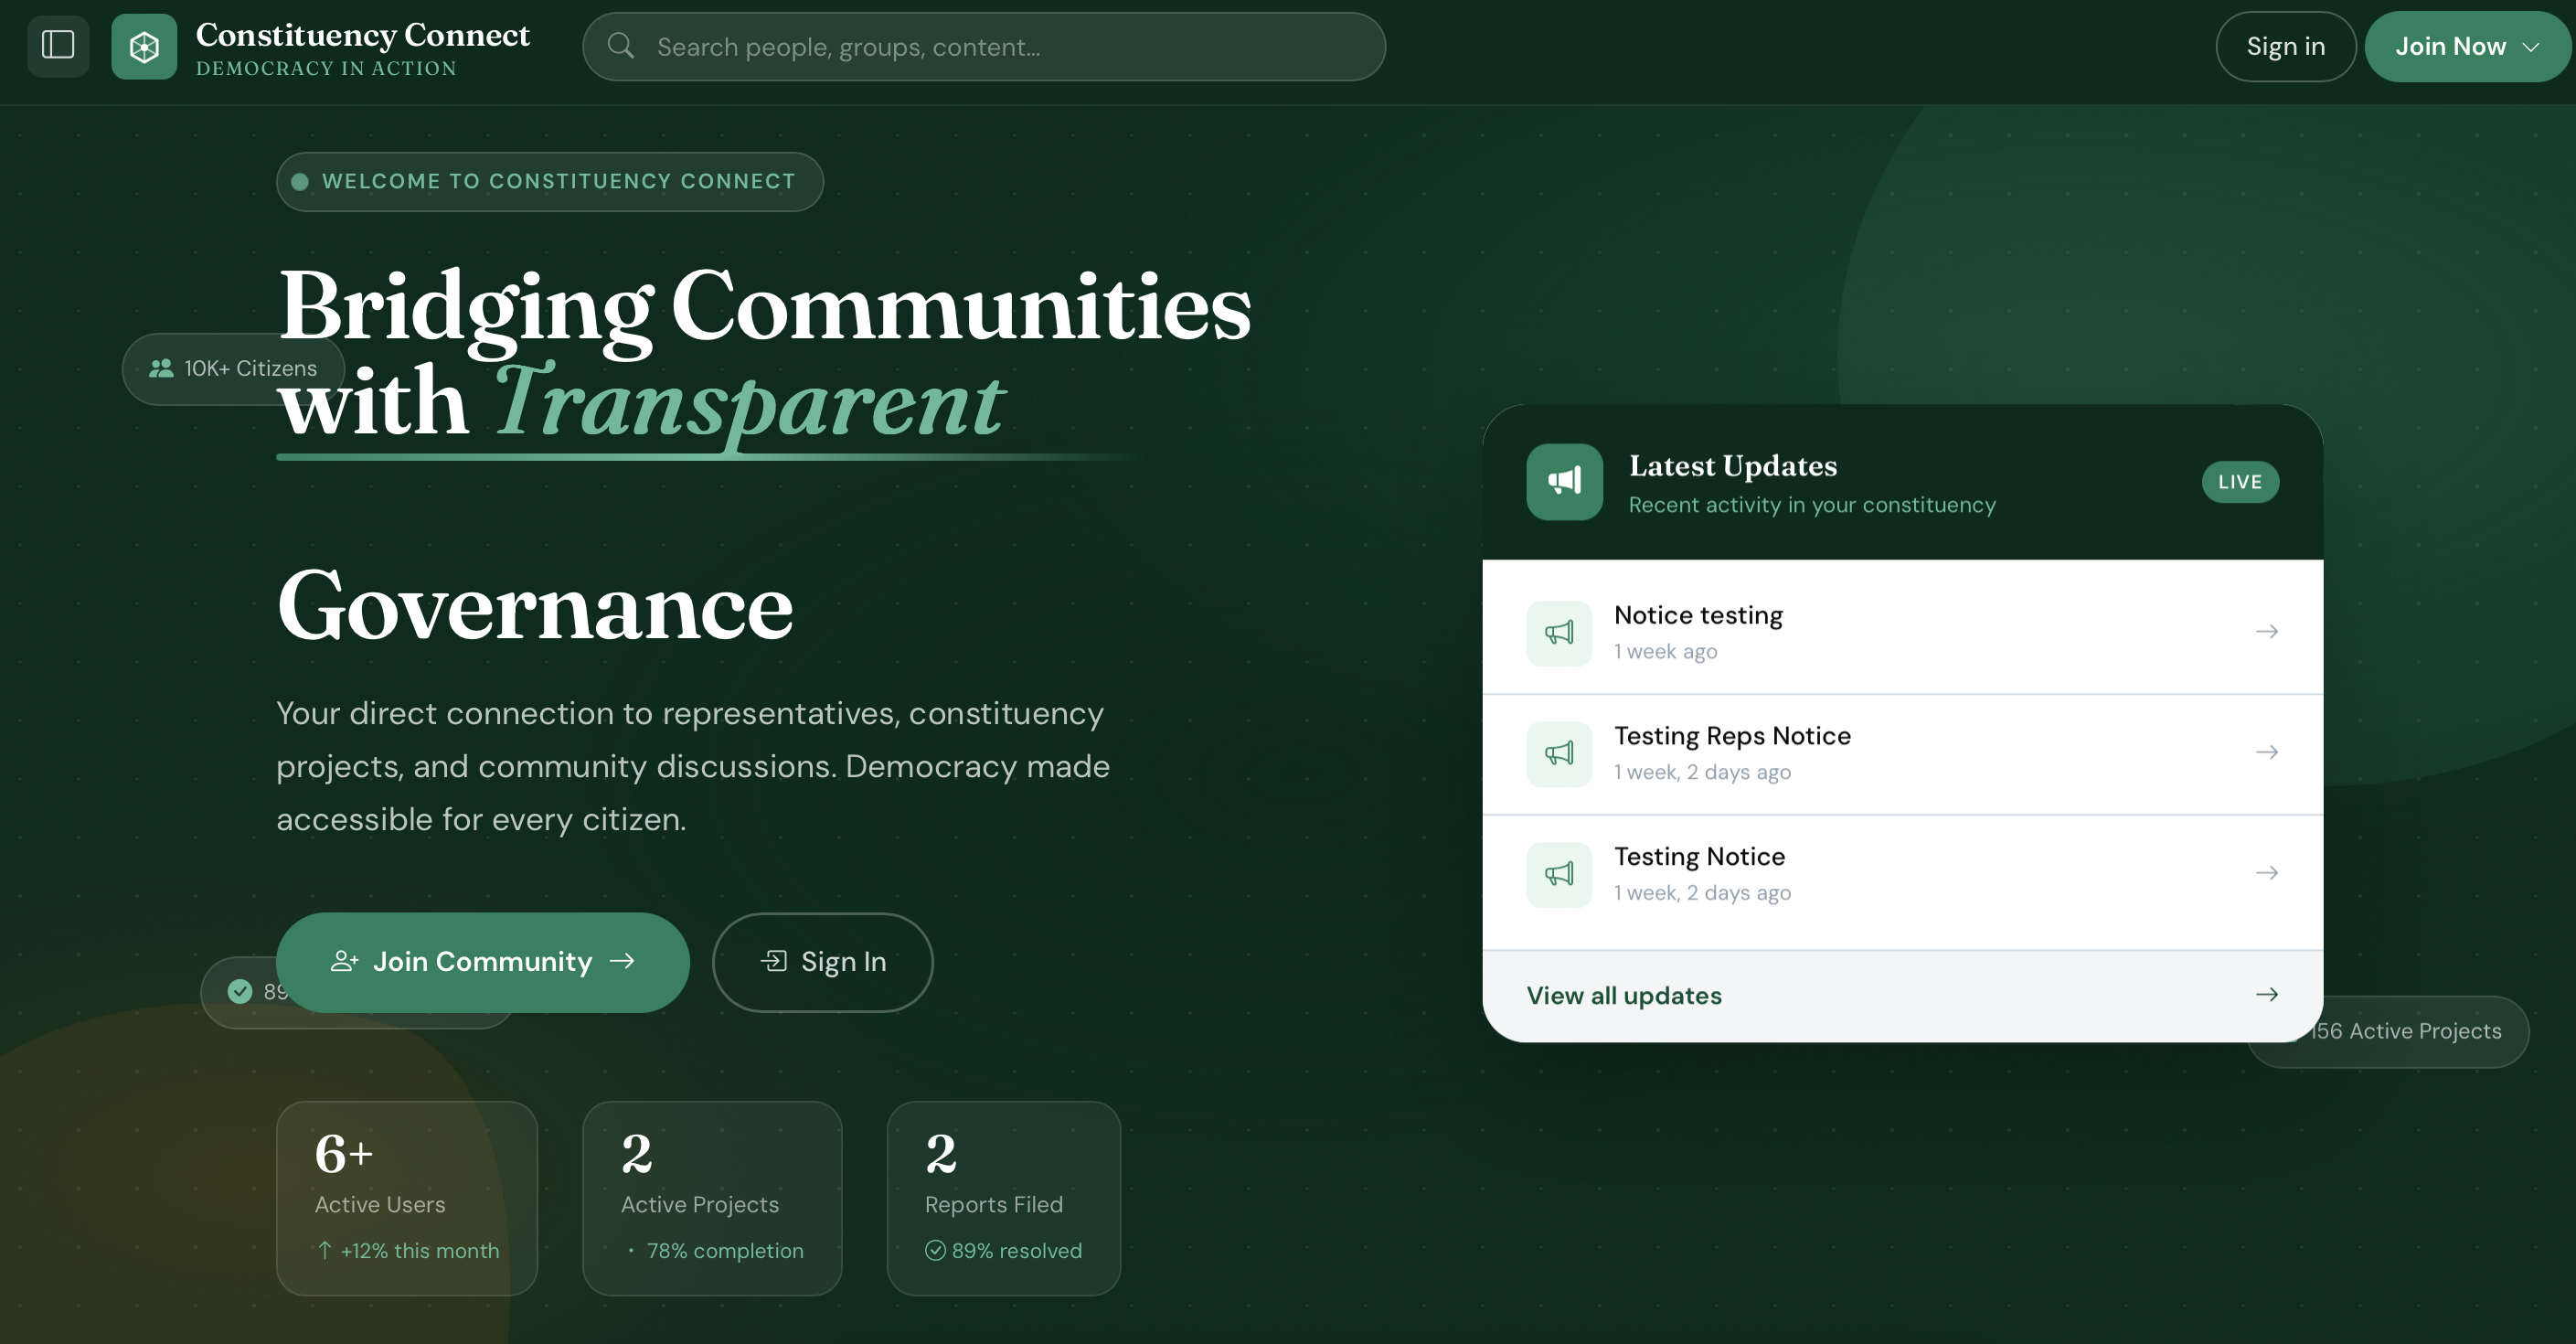
Constituency Connect
Digital platform for representative–constituent communication and engagement.
 Software
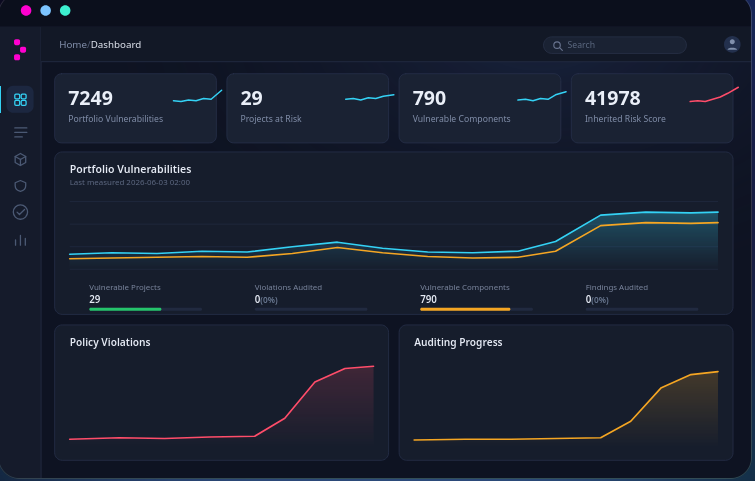
Vulnerability Dashboard SaaS
Security-focused dashboard application for vulnerability tracking.
Have a Technology or Infrastructure Project?
Tell us what you need. Our team can assess the requirement, develop a practical solution and provide a clear implementation plan.